Plot Annotation Tools
PyARPES has tools, in addition to those provided through Matplotlib, to add fairly general text based annotations to plots.
Additionally, PyARPES includes tools to add annotations purpose built for ARPES applications, including plotting cut planes and lines onto higher dimensional datasets, as when indicating the location of a particular photon energy plane on a kz dependence.
Annotating a point on a plot
arpes.plotting.annotations.annotate_point is a thin wrapper around
matplotlib.Axes.text. You can use it to place both a marker and a
text label for a particular point.
Annotating cuts onto ARPES plots
Using arpes.plotting.annotations.annotate_cuts you can plot the
location of constant angle or constant photon energy cuts onto higher
dimensional datasets. Internally, this is handled by forward converting
the coordinates of a piece of data to obtain the surface sampled by
the experiment on the higher dimensional dataset.
We can use this to plot a line of constant angle onto a Fermi surface
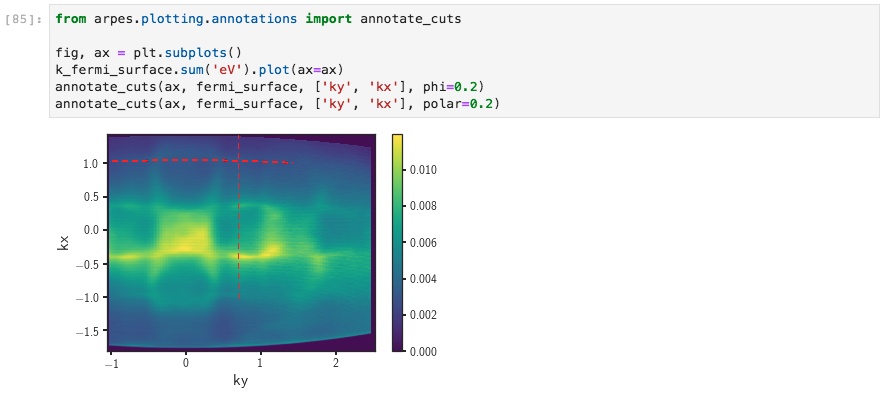
Annotation of constant angle onto Fermi surface
or a line of constant photon energy onto a kz dependence.
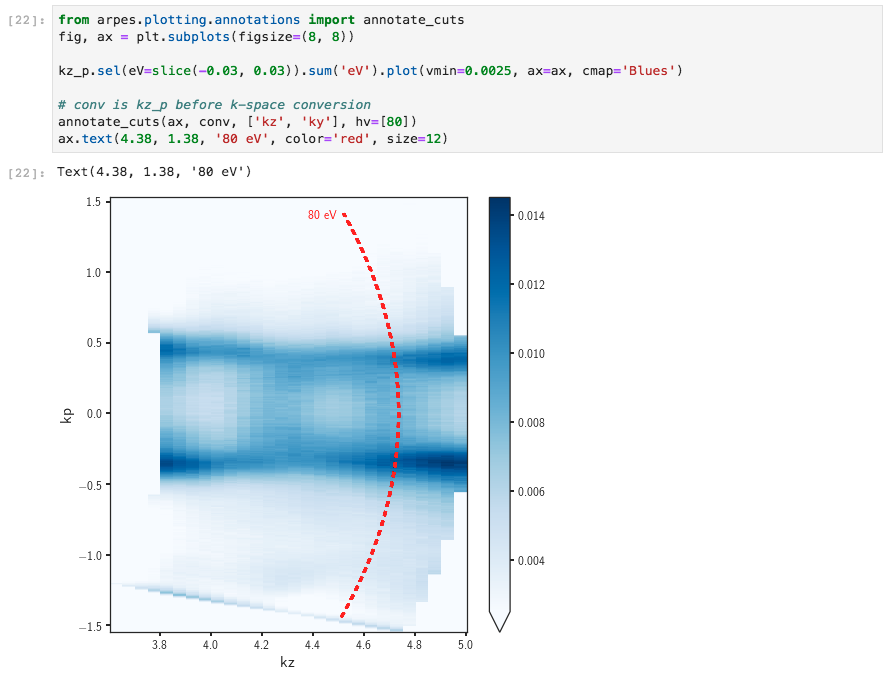
Annotation of constant photon energy onto kz dependence
These techniques can be used to highlight the location in k-space of a particular ARPES cut.