Plots Cut Through 3D Datasets
PyARPES provides 3D cut plots to illustrate the Femri Surface, and high symmetry direction dispersion at the same time.
Support is currently rudimentary in that the cut directions must be
orthogonal, but an intrepid user could easily add support for arbitrary
cuts using .S.select_around_data or .S.along and some geometry.
The current version can be found in
arpes.plotting.dispersion.cut_dispersion_plot and requires just the
data and the location of the constant energy cut via e_floor=.
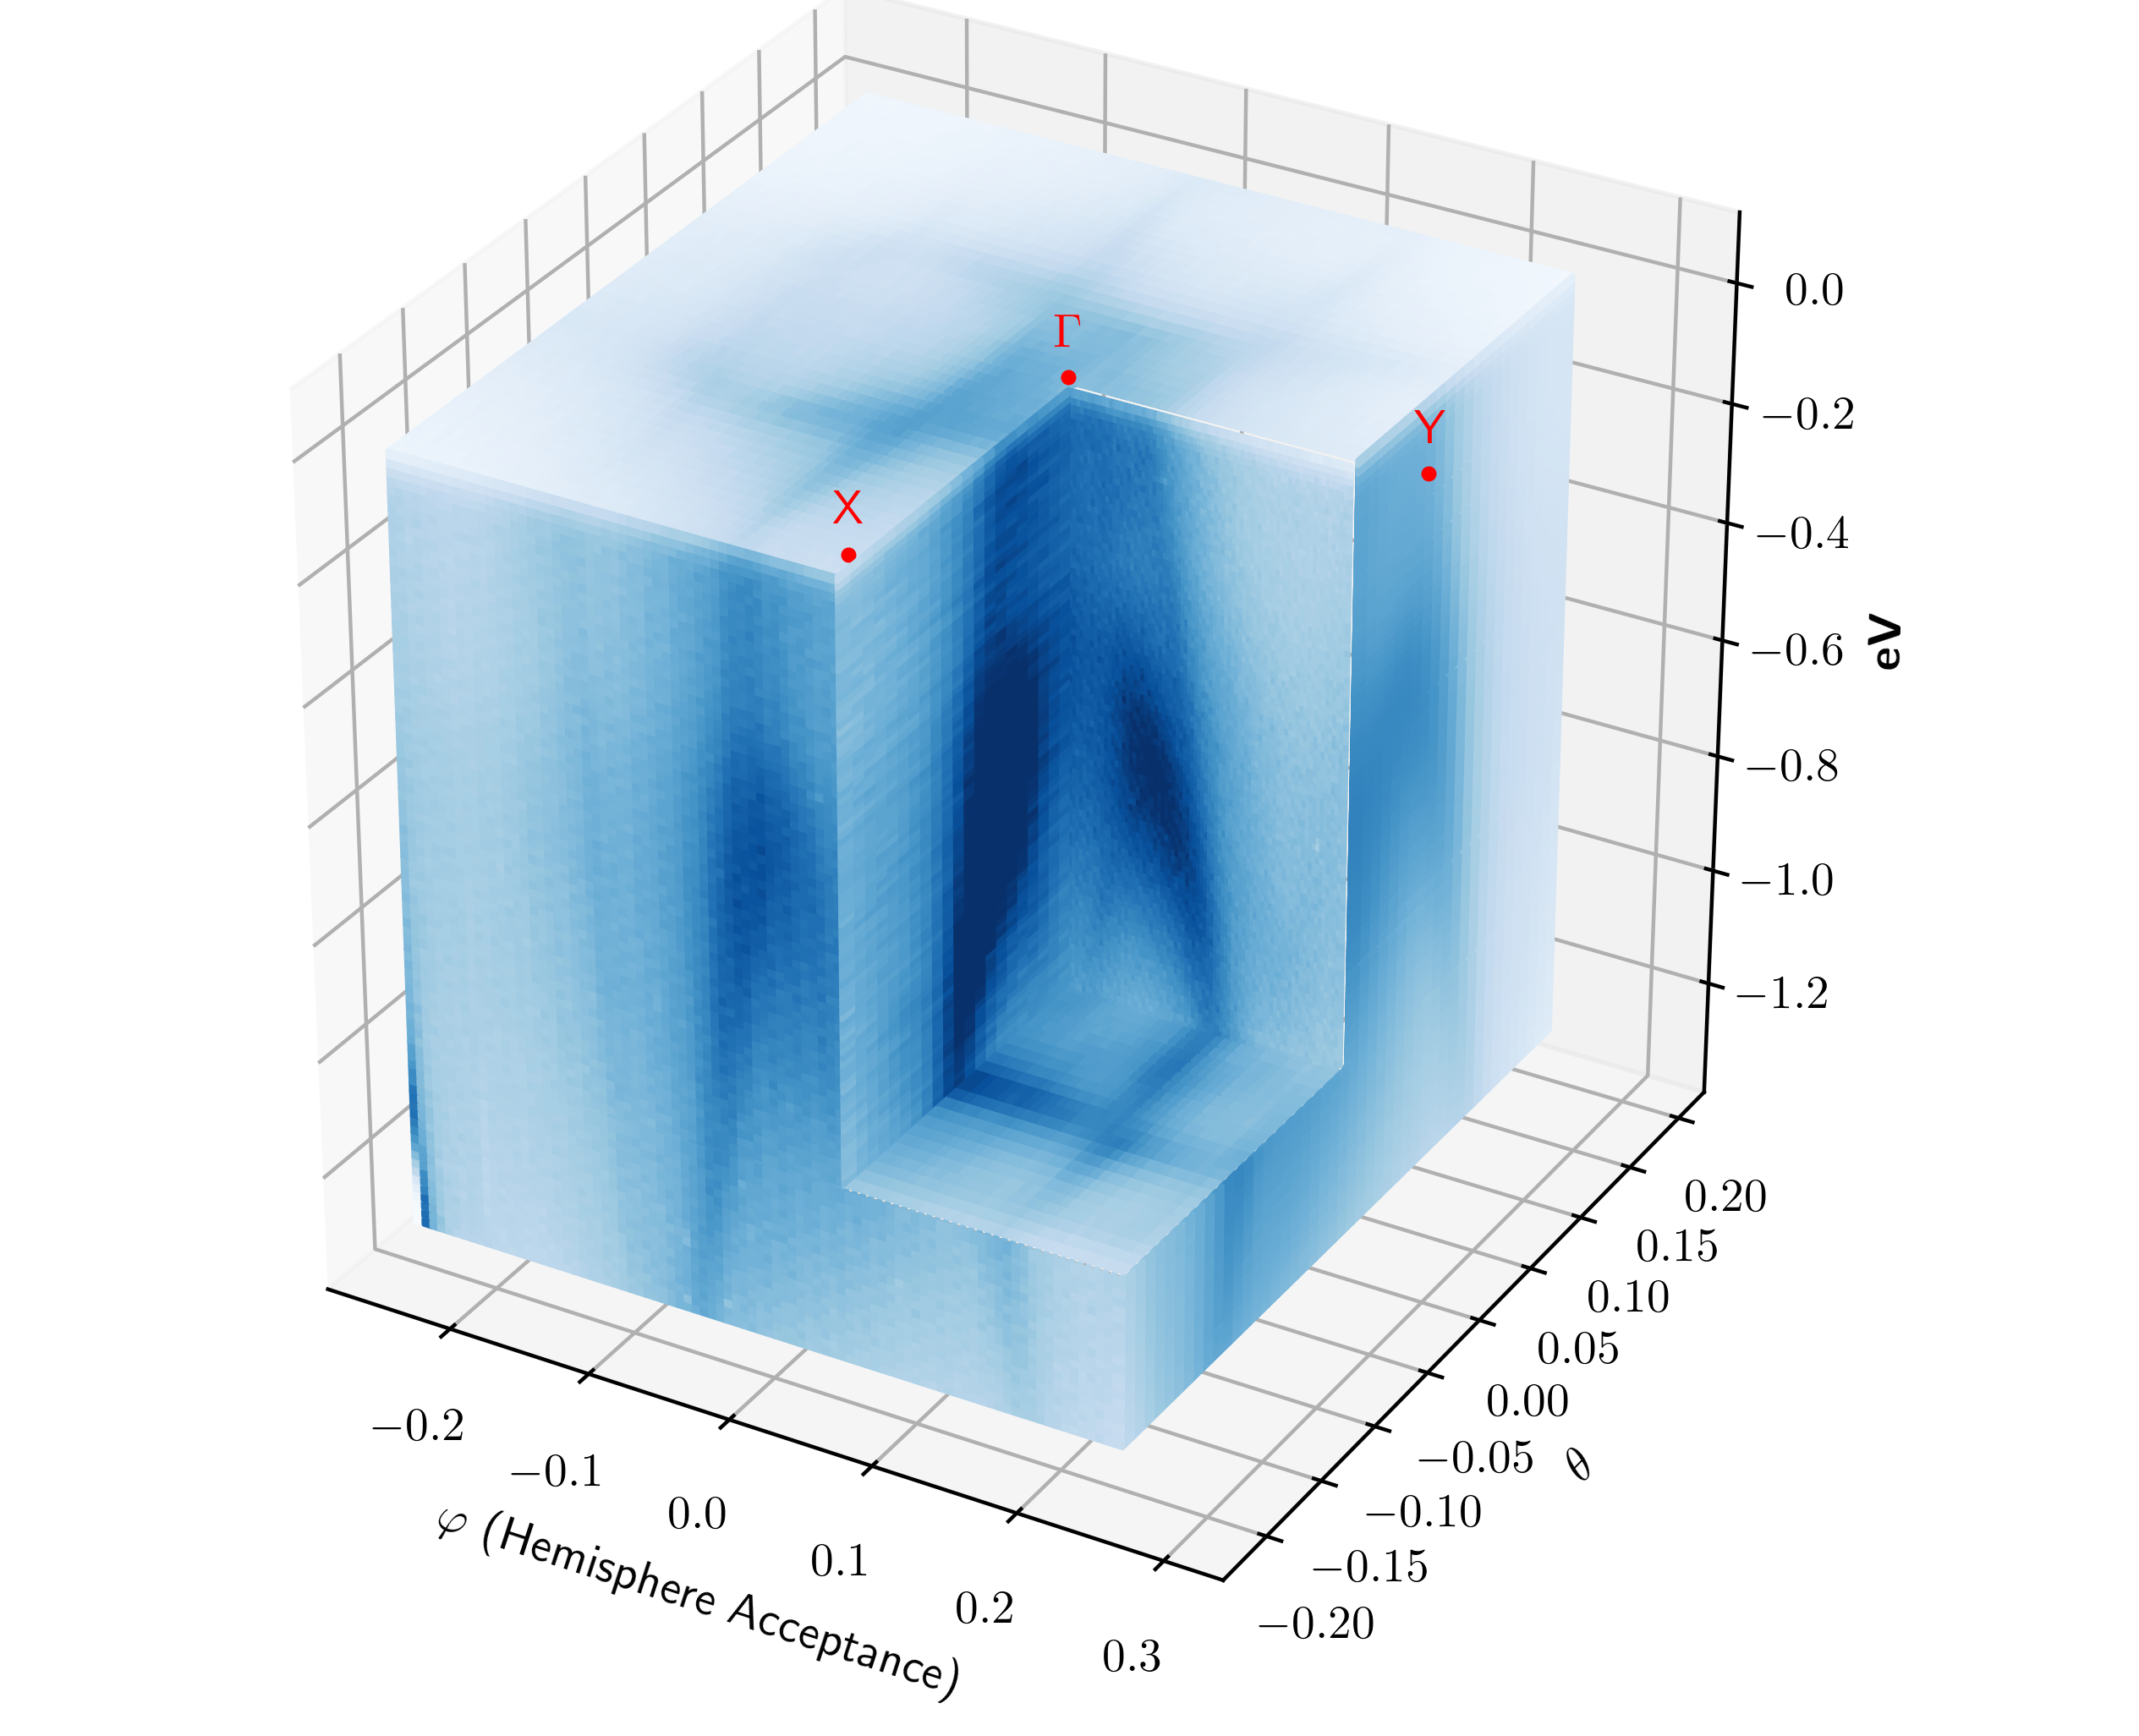
3D cut plot of a sample with orthorhombic symmetry