Interactive Exploration and Analysis
As the size and dimensionality of datasets increases, it becomes critical that a scientist be able to interactively view the data in order to understand how to ground further analysis. Unfortunately, increasing dimensionality and dataset size also makes interactivity a harder technical problem. This aspect of data analysis, especially as manifested in ImageTool, has been among greatest strengths of the ARPES community.
PyARPES solves the interactivity problem by offering two sets of tools in two different environments, depending on what a given user prefers.
QtTool or
qt_tool, an ImageTool-like native data exploration client for 2, 3, and 4 dimensional data exploration and visualizationBokehTool and other analysis tools built around Bokeh, an ImageTool-like data exploration and analysis suite
At present QtTool offers speed advantages over BokehTool because it runs natively on one’s computer. BokehTool can be run even in hosted Jupyter notebooks across the internet, but data has to be pushed across HTTP, which means that responsivity can be hundreds of milliseconds. BokehTool is supplemented by a wide range of interactive analysis tools that can be used to create masks, set up and examine curve fits, mark symmetry points, and interactively set parameters for smoothing and second derivatives or curvature analysis, among other tasks.
Furthermore, we discuss below how these interactive tools get around one of the most annoying sticking points of Jupyter notebooks, the problem of lost work through kernel restarts and hanged kernels, by being restartable even across different notebooks.
Using dyn_tool.dyn you can even make (almost) any function
interactive. This is an excellent technique for choosing good parameters
or testing a new analysis function.
QtTool
Should be relatively straightforward to use. This is very new so it should be improving rapidly, current quirks include:
No in-tool transposing
Color normalization does not persist across scrolling
Ultimately we aim to include most of the behavior from ImageTool 5 as well as a few other tools (like marking symmetry points) that are especially helpful in PyARPES.
Invoke with qt_tool
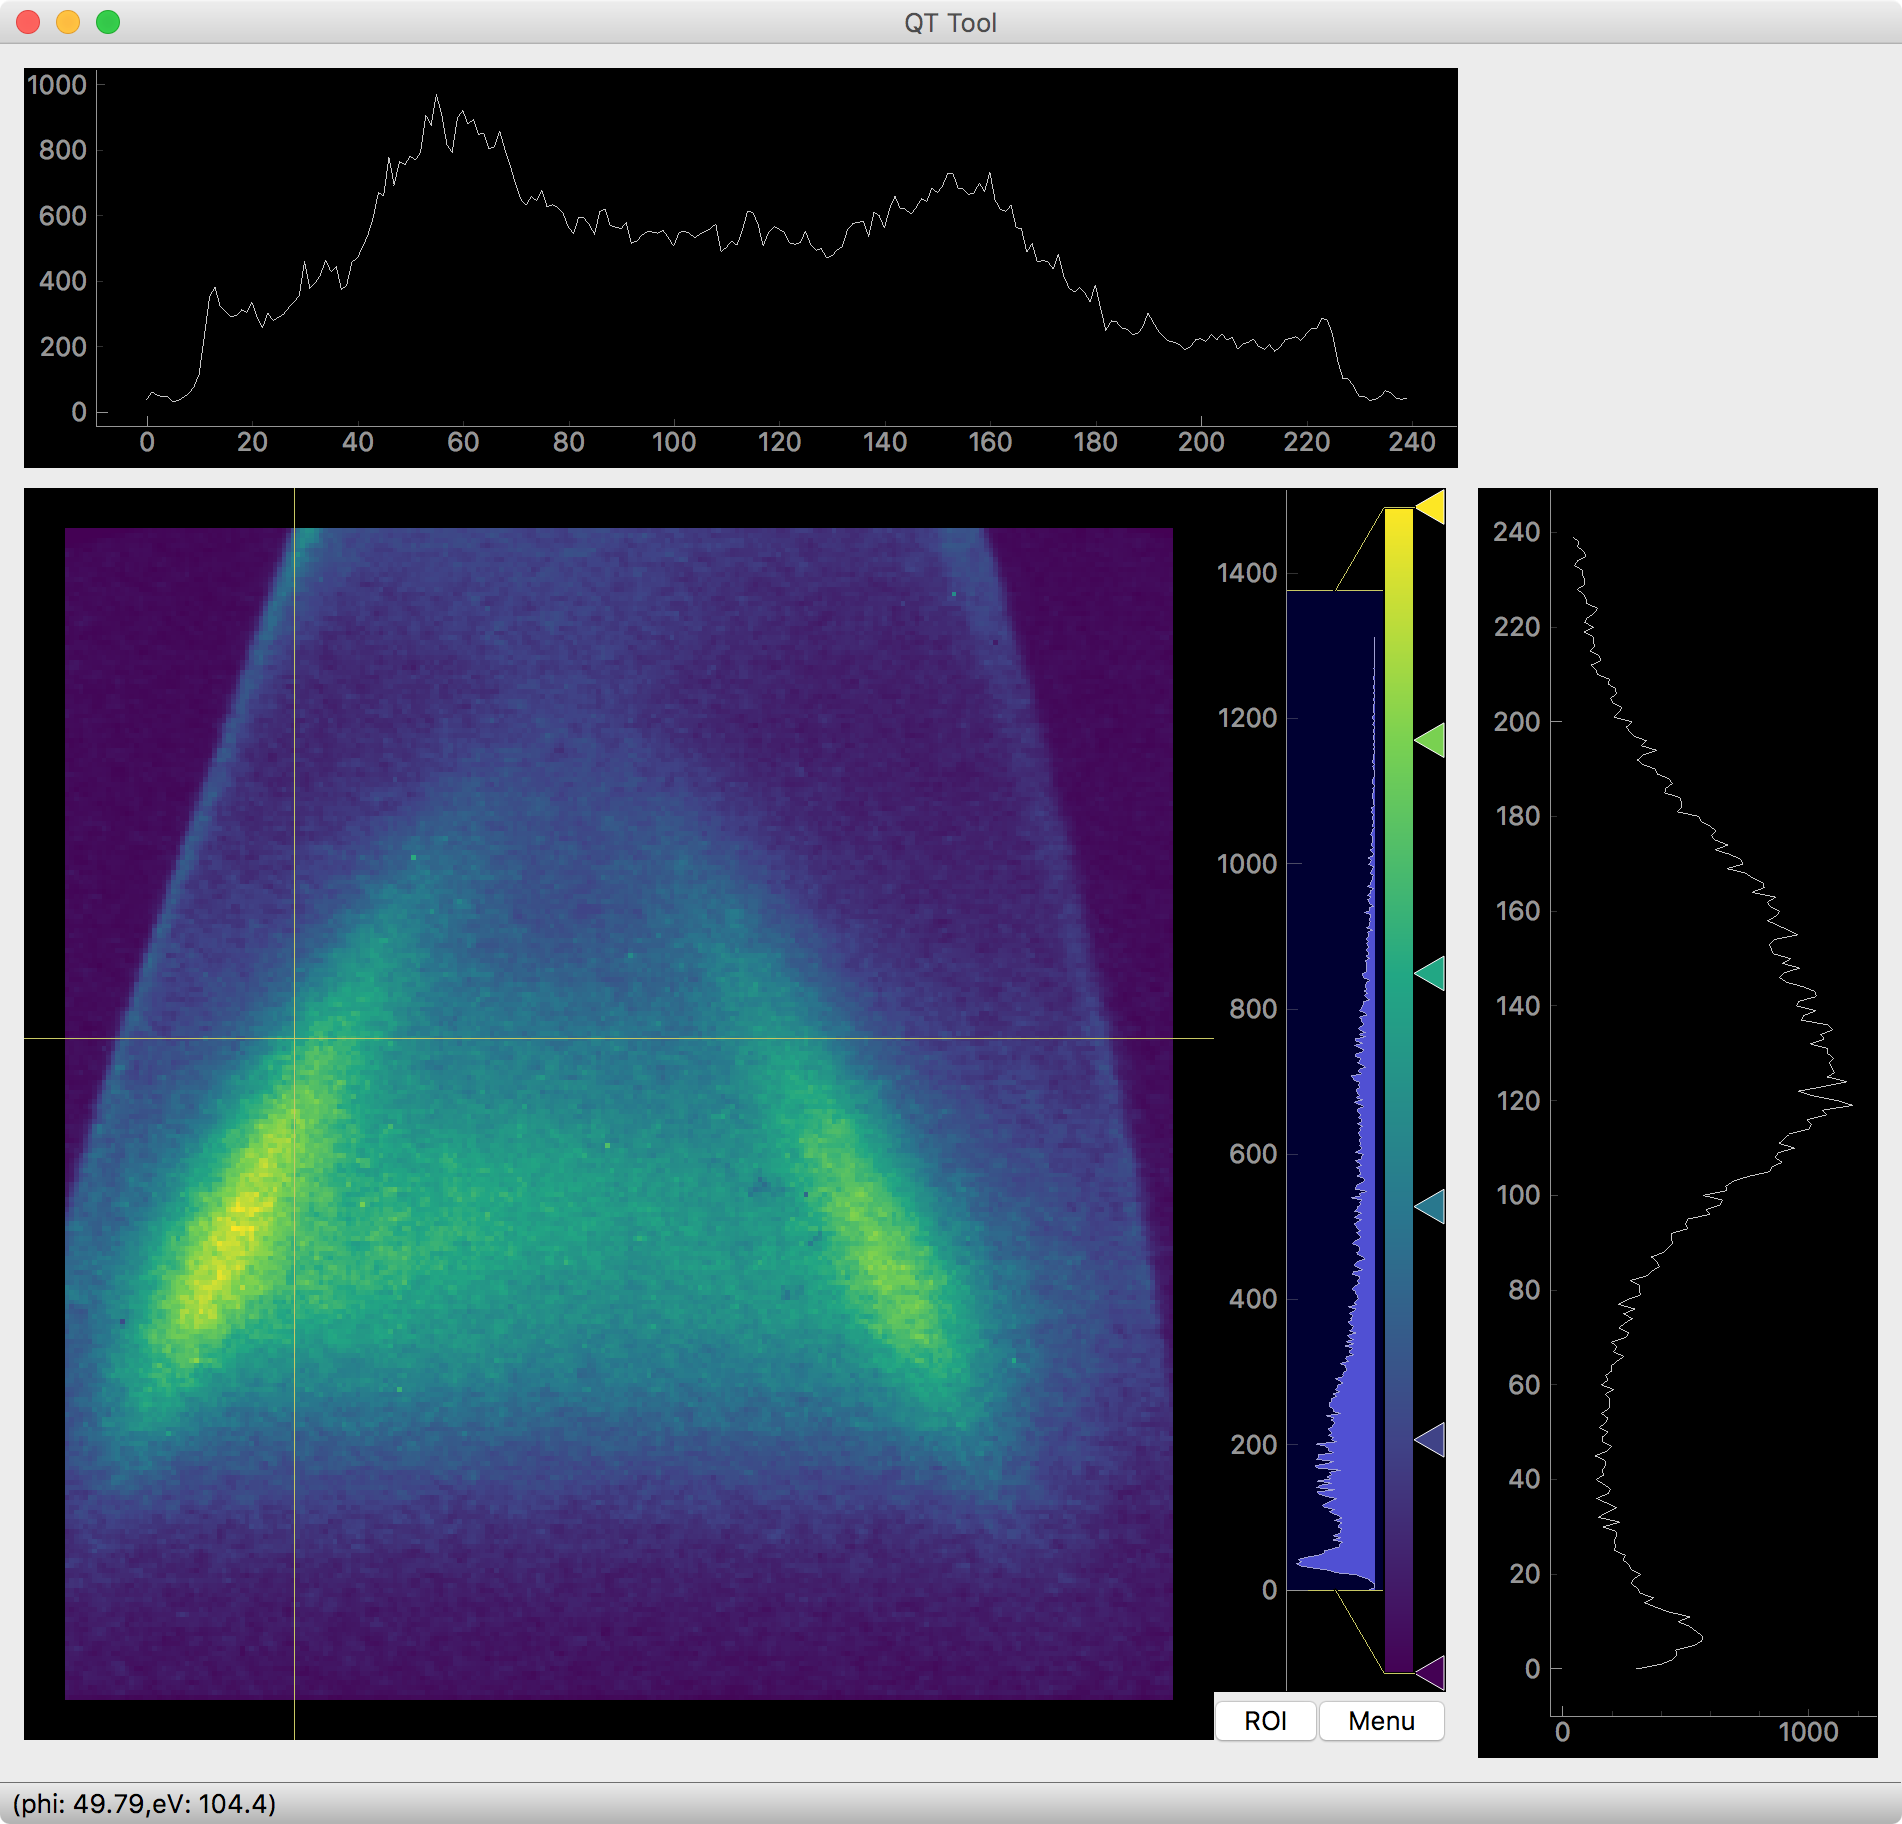
QT Tool
BokehTool
BokehTool works for 2D and 3D data, and runs interactively inside a Jupyter notebook cell. If the 3rd axis marginal is the binding energy energy axis, BokehTool will attempt to do a step edge curve fit and present it in the marginal.
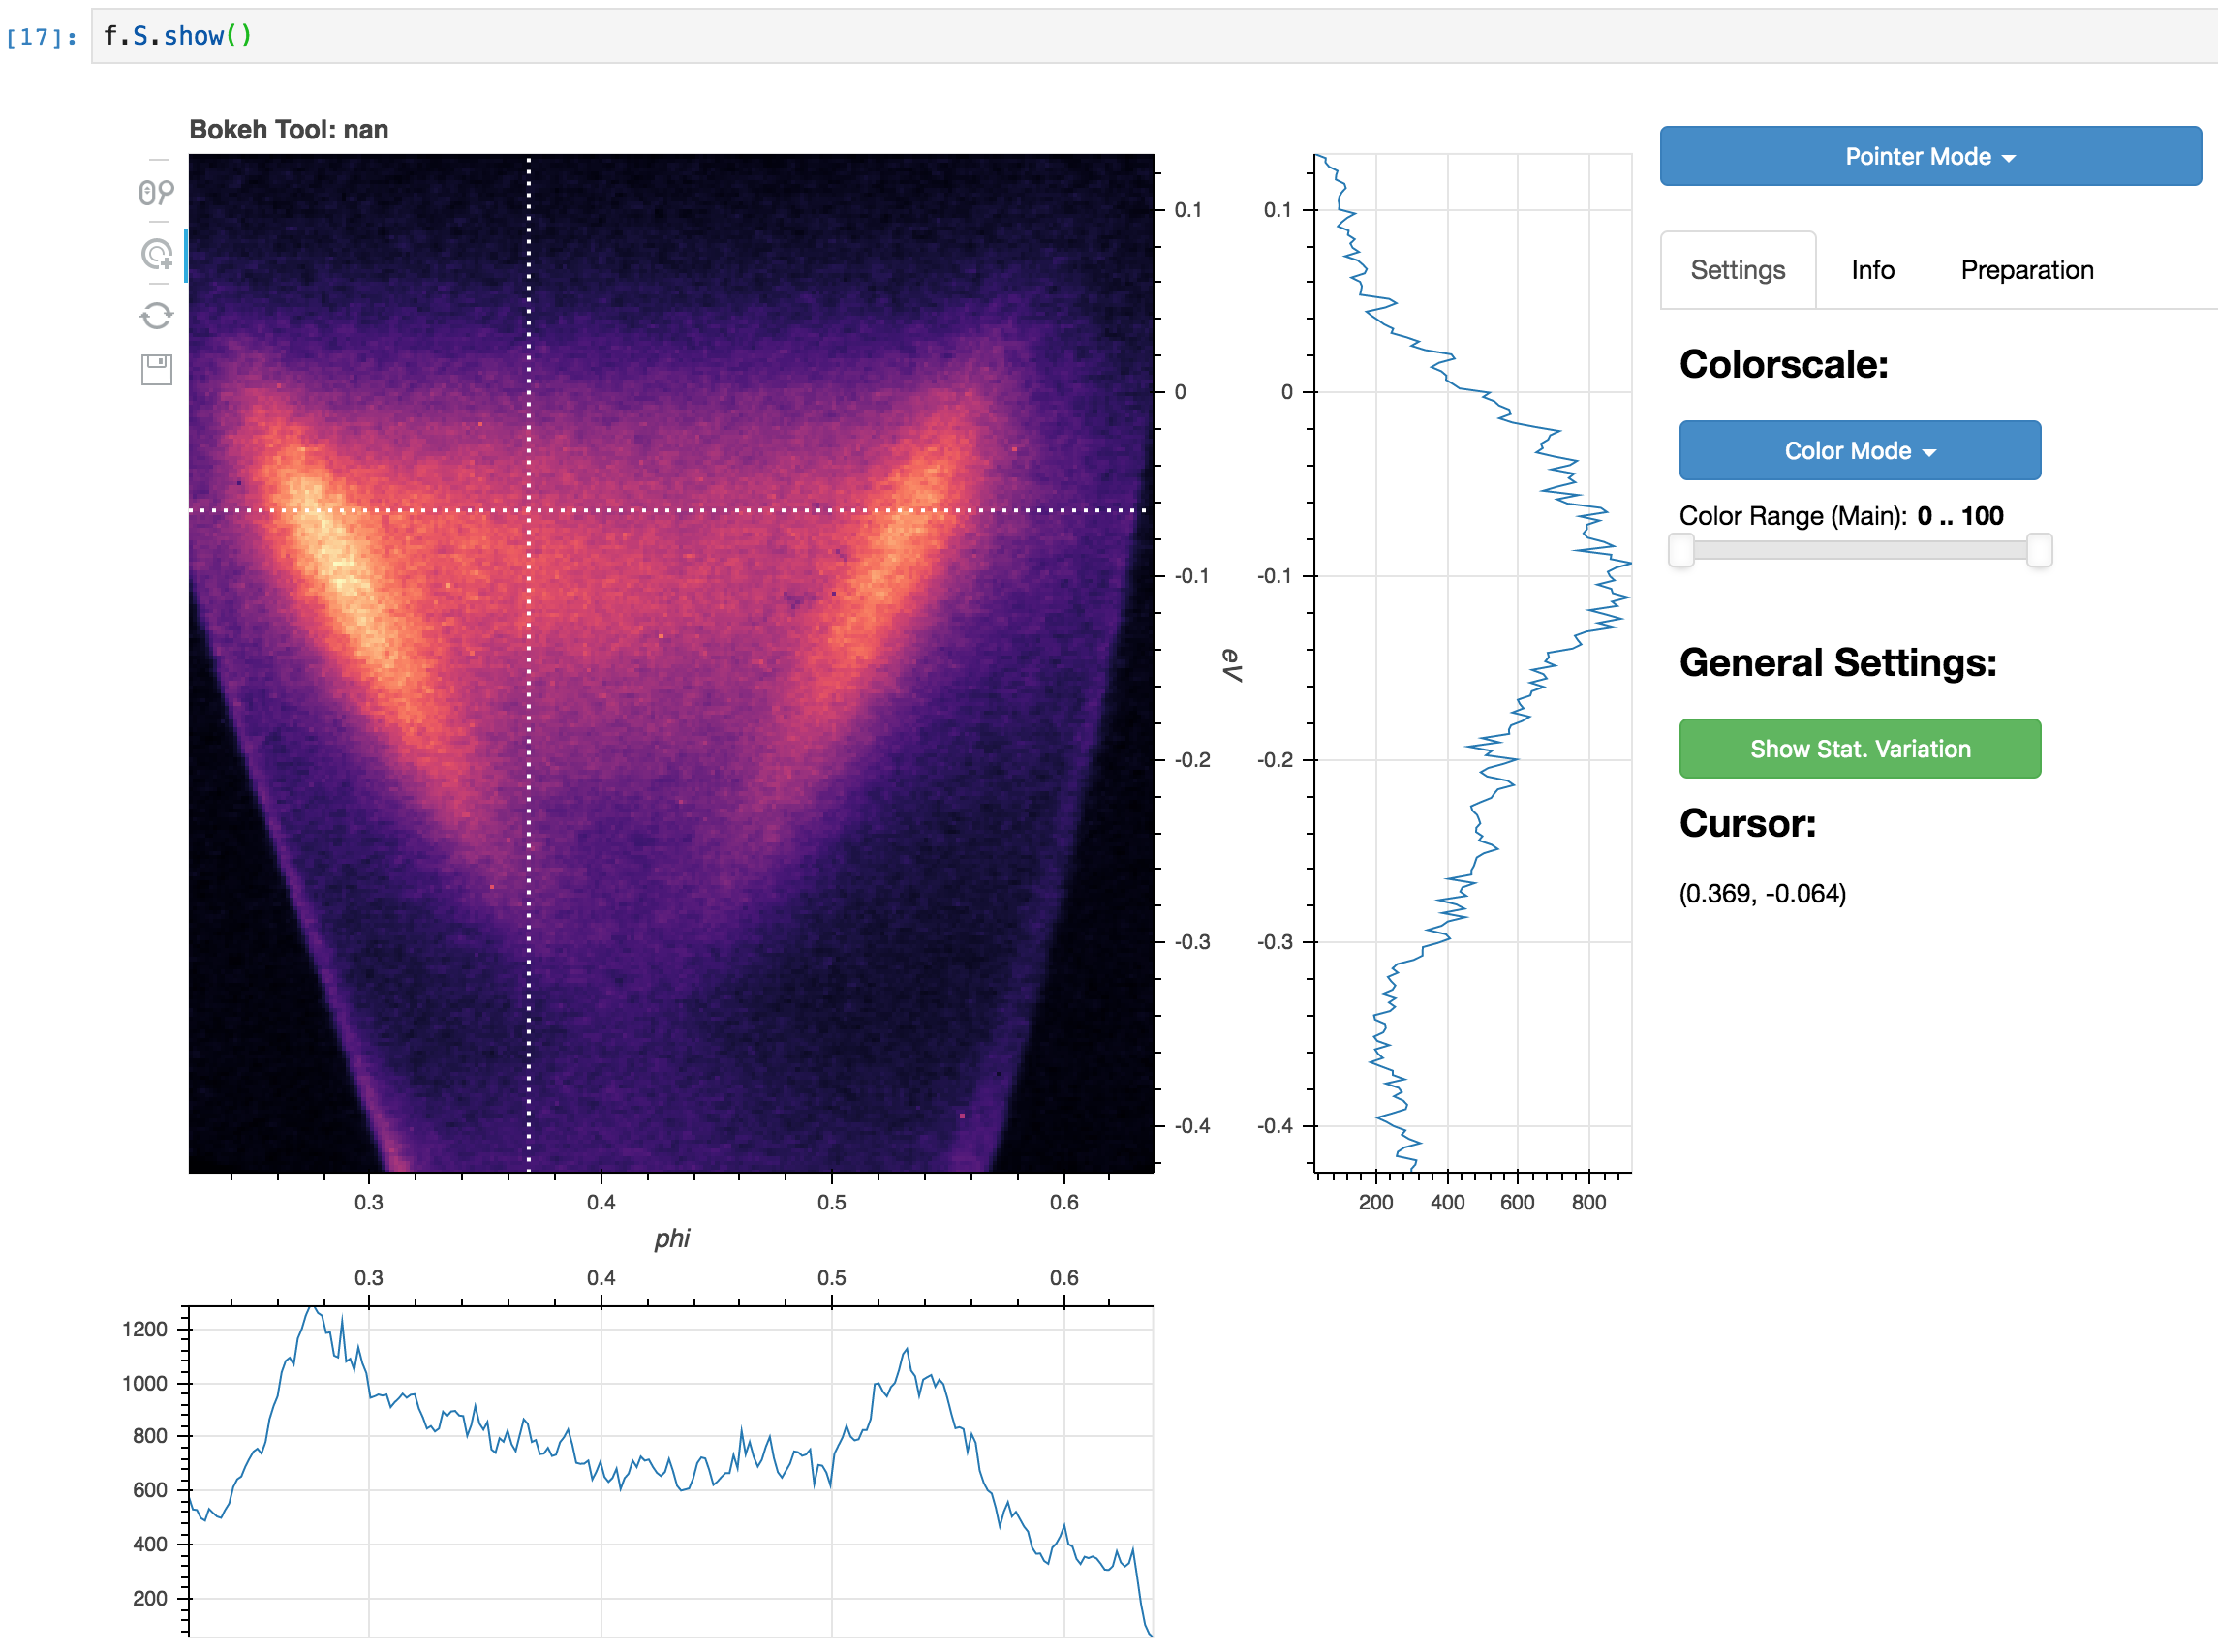
Bokeh Tool
Restarting
You can make almost any Bokeh based tool restartable (i.e. if you rerun
the cell you will restore the state of your tool) by giving it a name
with name="some name". A name uniquely identifies a session, so keep
separate names for separate tools. Tool states are stored in project
folders, so you only need to worry about name uniqueness across inside a
single project and not across them.
Laying Lineshapes for Curve Fitting
Use .S.show_band_tool() to get an interactive lineshape/band layer
to set inital locations and model structure for complicated curve fits.
Examining Fits
Use .F.show() to get a tool that allows interactively examining
curve fit
quality.
Interactive Derivative Analysis
Use .S.show_d2() to get a tool to interactively tune smoothing and
derivative analysis parameters.
Making Any Function Interactive
One of the advantages of using a dynamic language for scientific data analysis is that new interactive tools can be built very simply. Additionally, it is possible to build tools that allow you to make an arbitrary analysis interactive.
Here, we will turn arpes.analysis.savitzky_golay.savitzky_golay, a
popular 1D and 2D filter used sometimes in ARPES for smoothing data into
an interactive tool, allowing us to choose good values for the two
filter parameters. Because the extra filter parameters window_size
and order are not marked as integer, we will have to tell dyn
their type.
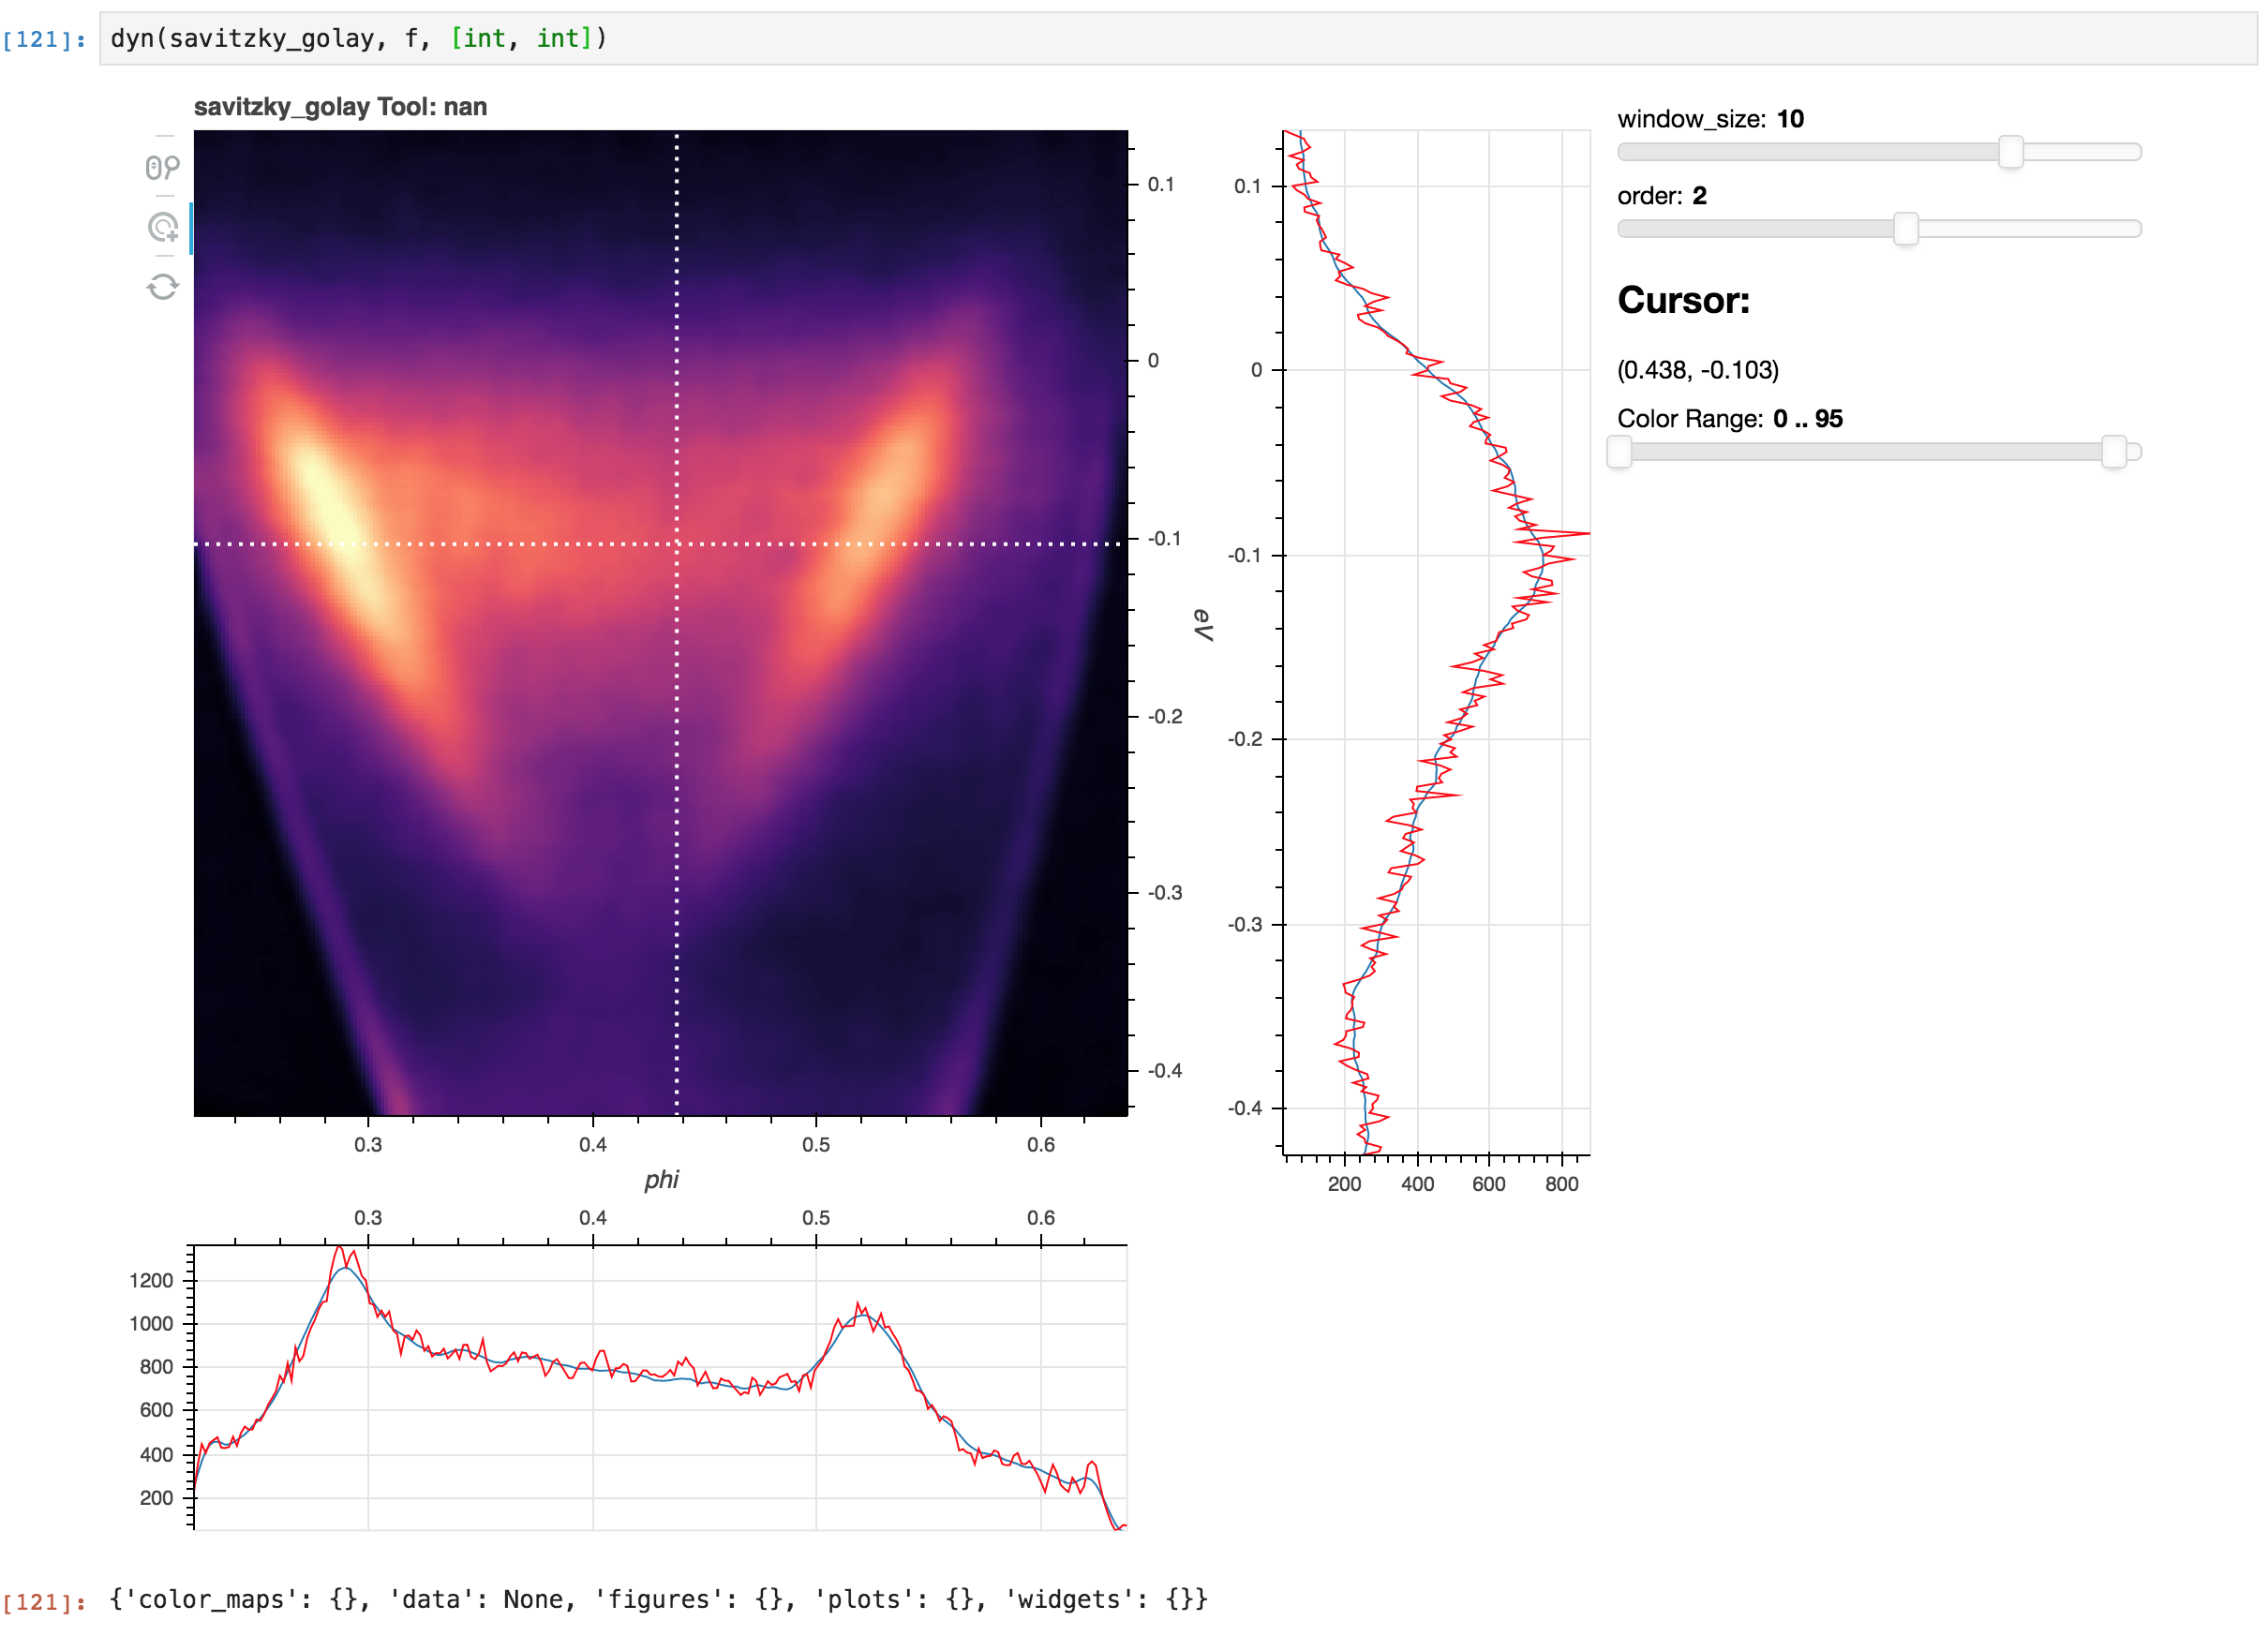
Making a dynamic Savitzky-Golay filter
In the marginals, the red data is raw while blue indicates the result of applying the function with the values selected by the sliders. The image data is the full filtered dataset.